Family Promise: Fulfilling A Promise to Myself

June 2021 has been incredibly rewarding for me. I was given the fantastic opportunity to join a team working to develop a Monitoring and Evaluation platform for a nonprofit called Family Promise. We were given one month to fully design and implement our vision. This organization goes above and beyond to combat homelessness in Spokane, WA, and have been doing so since 1998. As with many nonprofit organizations, one of the biggest hurdles for Family Promise is funding. To overcome this, campaigning and applying for grants is a necessary part of the business. In order to make this possible, nonprofits use Monitoring and Evaluation platforms (M&E) to track a wide range of metrics regarding the services they provide. Thus, Family Promise collaborated with Lambda School to have this platform built by graduating students. The ability to track things like the density of a particular service provided in various neighborhoods, or the cost of services provided, or even ratios of male recipients to female recipients can open up doors to grant money that would be much harder to argue for without an application designed to track these very metrics.
That’s where I come in…
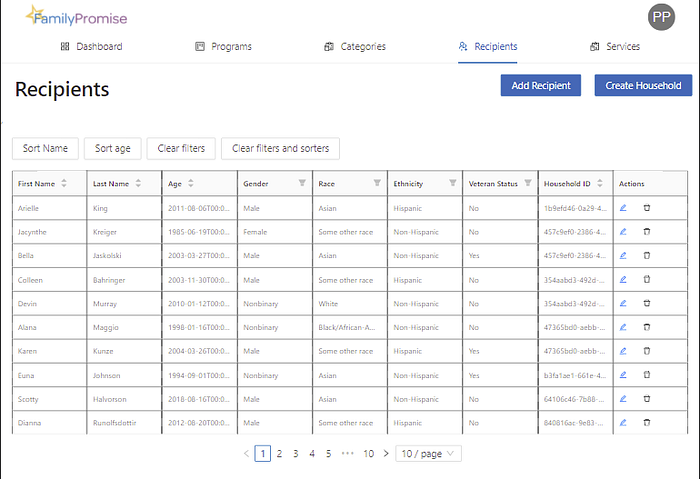
My team of 19 students, comprised of 14 web developers and 5 data scientists, was tasked with creating a user dashboard on an existing app that was being used by Family Promise staff to input service entries upon completion of a service. This user dashboard would need to display to the user various visualizations, such as graphs or geolocated maps, that would be populated by data coming from the data science team. Long story short — Family Promise needs to be able to look at this dashboard and see clearly the impact that they are having in the neighborhoods they serve.
Only there’s a problem…

The structure of the database when my team received the codebase lacked the flexibility that would be required to render meaningful, customizable data and metrics to the user. I was excited and intrigued by this problem, and so I elected to join the backend web development team, as I would be able to get hands-on directly with the database. We decided that it should be a priority to restructure the database and add additional tables of data. As with any major restructuring of a backend schema, a major concern is how much technical debt will be incurred as a result of the change. Something as small as a change in the name of a variable would make the application inoperable. If a column name changes in the database, the same change must be made at every point in the code where the column is referenced.
You may be thinking, ‘so what? Is it worth the risk?’
However, we knew we would be unable to reach our goal of providing meaningful data analytics to Family Promise without first completing this task. The risk was necessary.
Collaboration is Key!
Knowing the risks, my team arranged a meeting that took most of a day. We all worked together to generate a brand new schema for the database, which would work well for all teams — frontend, backend, and data science.
Behold!

Though it may appear overwhelming or confusing to some, this larger database was absolutely necessary to fulfill Family Promise’s vision for this application. Their biggest priority was for staff and administrators to be able to see charts and graphs for any data metrics imaginable, based on the services provided by the nonprofit.
As just one example, by our team ensuring that each relevant table includes a ‘timestamp’ column that records the time/date of the record’s creation, Family Promise is now able to populate a graph showing changes in data over time. How many services were provided in a certain zip code six months ago, as compared to today? How many Hispanic children under 10 years old were served in the past year? All of these questions and more can now be answered and displayed on the user dashboard, where before they could not.
Divide and Conquer
Knowing the shape we needed the database to be in, my backend team set three big-picture tasks that needed to be accomplished before the month ended:
1) New migration and seed files needed to be written.
2) New endpoints needed to be constructed for frontend to pull the new data.
3) New model functions needed to be written to shape the incoming data exactly how frontend needed to receive it.
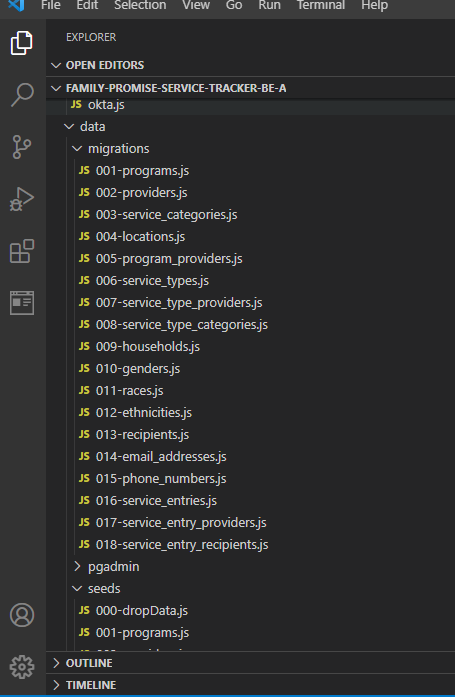
Creating 18 tables meant writing 18 migration files and 18 corresponding seed files in order for us to be able to test the functionality of our endpoints locally, and also to render dummy data to the frontend so they could test their work as well. We divided these files up evenly, so that each backend developer created 3–4 migration files and the same number of seed files, and this work was completed the same day.
Similarly, we divided evenly the tasks of creating each endpoint and model function, such that each backend developer was contributing a similar amount of work to the overall project.
But there was still a problem when it came to Family Promise’s desire to have each employee able to define their own custom metrics.
It’s a bird! It’s a plane! It’s...a JSON Column!
By providing specific endpoints on the Node backend, it’s easy enough to provide many different metrics, but the metrics must be predefined before shipping the product. So how can we ensure that the end-user is able to define and customize data into metrics that our team might not have thought to include in the final product? Our solution to attempt to tackle this was a JSON Column, a relatively new feature to PostgreSQL. Where normal table columns contain data of a single value (such as a person’s name, or a location, or a timestamp), a JSON column can contain an entire JSON document. This allows for denormalization of data. This is useful because we as developers cannot anticipate every possible metric that might be desired by the end-user. This will allow for a much deeper level of customization than traditional relational columns.
So how does it work?
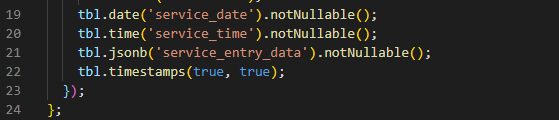
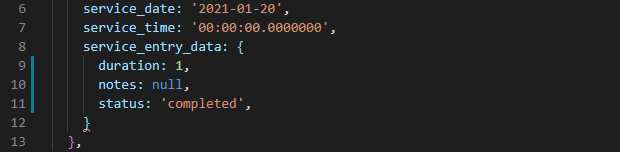
The first image below is a snippet of our table of service entries. Notice the implementation of the JSON column on line 21. In the second image, we seed the service entries table with some dummy data. You can see that the corresponding ‘service_entry_data’ column is seeded with a JSON object containing the custom metrics for ‘duration’, ‘notes’, and ‘status’.
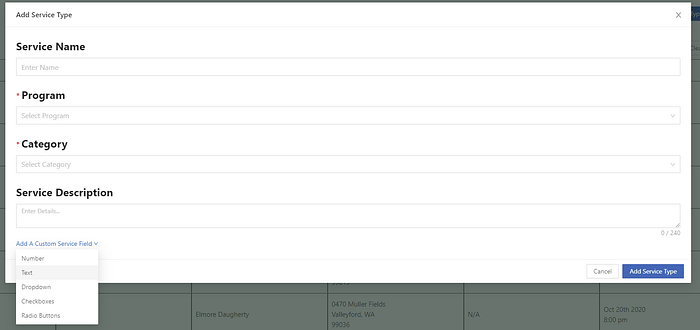
However, these fields are not required. In fact any information can be placed within the JSON object, and can be sent to the data science team for rendering a visualization, or directly pulled by the frontend team to include in a table shown on the user’s screen. The following image is a snippet from our ReadMe file, which provides a guideline for a uniform way that this data could be structured, to make it easier for Family Promise to receive this and implement it.
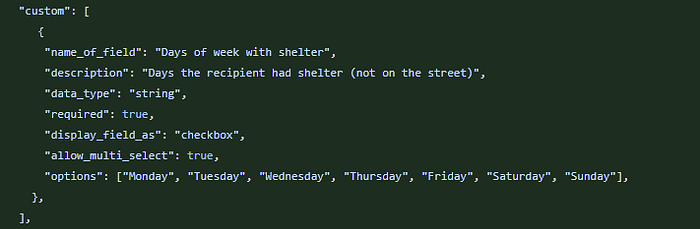
This is an example, of course, but the implications for customization are clear. The ability to specify the custom field, the type of data, whether or not the field should be required, and even options for the field, will allow future developers who inherit our code to really take the metric visualizations and run with them.
Where we stand
At of the end of my month-long journey with the Family Promise Service Tracker app, most of our goals have been reached. Speaking for myself and the backend team, restructuring the database and cleaning up the bugs that this caused ate up more time than we had anticipated. Still, all endpoints are functional, data is being passed back and forth properly between our server and the frontend. Another bonus is that I learned a LOT about working on a cross-functional team. The benefits to this over being a lone-wolf coder are astounding. The amount of work that we were able to accomplish in the past month would have taken me multiple, had I undertaken it alone.
Being able to ‘divide & conquer’ our assigned Roadmap made the whole process much simpler to conceptualize. Here’s what I mean… When I looked at the assignment on the first day of this project and saw all of the work that needed to be done, I didn’t even really know where to begin. It seemed intimidating and overwhelming. However, once we divided into teams and created concise, manageable tasks for each team member, the image of the path before me really began to take shape. And today, the app is able to render all data from the newly restructured database, and we have forms implemented for the user to add new recipients or services.
One aspect of the Roadmap that we weren’t able to accomplish this month was the implementation of predictive models that could suggest to the user various recommendations for their services. For instance, based on the low turnout for a soup kitchen in a certain neighborhood, but a high level of need for food in another area, the app should be able to make a recommendation to the program manager to perhaps alter the location of the soup kitchen service.
When the next group of developers takes over where we left off, I foresee one challenge being the predictive models. Similar to our issue with being unable to predict every possible metric the user might want, future developers working on the Recommendation feature will need to predict every possible recommendation the user might want to see.
Turning my eyes to the future
My experience working on the Monitoring and Evaluation platform for Family Promise has been incredible. The scope of everything we were able to accomplish in only a month has shown me that working on a cross-functional team is truly the best way to meet goals and ship quality features. I have become more confident in not only my coding abilities, but in my ability to be a good teammate. I am driven to work hard, and help support my team wherever I can. Very little will be accomplished without cooperation, and I found that I truly thrive in this setting. I was always excited to start the morning standup meetings, decide what tasks we would be tackling that day, and get to work! My favorite day by far was getting the whole backend team together to iron out the database schema. Each developer had something tangible to offer, something new and different to bring to the table, and we all learned from each other.
In a technical sense, I’ve grown much more confident in my abilities with Node.js and Express environments, as well as working with OKTA authentication, which I had never done before this project. Working on the Family Promise Service Tracker app has definitely made me a more well-rounded developer. The majority of my learning experience has been working with frontend development, so it was extremely valuable for me to work solely on a large-scale backend project.
Making the decision to completely upturn my life and join Lambda School to start a new career was scary, but everything I’ve learned along the way has left me feeling nothing but confidence that I made the perfect decision. I made a promise to myself to turn my life around, and learn a skill where I could help others in a meaningful way. Learning web development has so far been a fulfillment of that promise.
I feel confident and prepared to take on the next project that comes my way. I’m looking forward to finding solutions to new problems, and I can’t wait to get started on what comes next!
